Folklore #4: If Something is Audible, Then That Something Is Measurable

You'd often see these phrases pop up now and again when audiophiles are "discussing important topics":
- If something is audible, then it is measurable
- If something is measurable, then it is audible
Are there any truths to these statements? Personally I do not think so. These statements appear to be legitimate on the surface. Poke a little bit deeper however and they become utter and complete nonsense.
In my opinion (of which there are certainly lots of grounds to disagree with me here), the above statements are complete bullshit.
And here is why, to suggest something is audible is measurable (or vice versa) implies a direct causation relationship. That cannot be true because the two are completely different concepts:
- Audible is about the interpretations of sound
- Measurable is about the physical characteristics of sound
Not understanding the limits of Science is a dangerous thing, misunderstanding can turn this discipline into a cult. Hopefully this is not not something Ia m about to do next!
- If something is audible, then it is measurable
- If something is measurable, then it is audible
Of the two statements, the first is the most common. The second is rarely used but it does come up once in a while. Taking both in context, we note that item 1 has reached Internet consensus acceptance and item 2 is debatable. In general terms, the established train of of the Internet collective are roughly split into two camps.
The first camp is what most (if not all) hobbyists begin with. This group quite rightly understand that measurements capture a portion of what is audible, but it's not the complete picture. Pictorially this belief system can be represented by the following Venn diagram, showing a overlap of what is measurable versus what is audible:
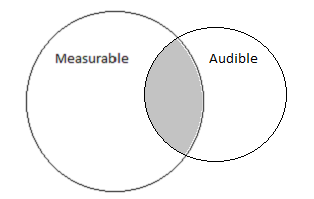
Unfortunately over time with more experience in this hobby, a small percentage will diverge and start to merge the two circles closer and closer until eventually their belief system will end up like so:
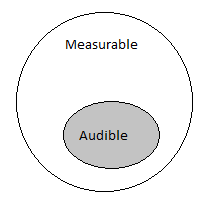
This second group is now convinced measurements is all encompassing and what a human can hear can be captured by measurement systems. After all, the widely accepted human hearing threshold starts at around 20 Hz to around 20 kHz while measurements can measure in terms of MHz. Stands to reason machines are superior.
With this second group their belief is so strong they have turned militant. If you claim there is a difference in some of the more fringe tweaks in Hifi, this is the group that will always jump in first to insist you back your claim with measurements.
This claim is catchy and has a slogan vibe to it. Reasons why it can stick long enough in some people's minds. At the end of the day though the claim is groundless - the notion that something is audible implies it's measurable (and/or vice versa) is flawed and illogical! We can use transposition logic to demonstrate why.
Transposition logic is defined as follows:
P → Q ⇔ ¬Q → ¬P
Read as so: P implies Q, if and only if, not Q implies not P. Implies in this context means "leads to", "implies", or "means". What the above equation means is in layman terms is
if P is true, then Q is also true if and only if Q is false means P is false.
In other words, transposition logic have the following properties:
- When we know P is true, then we know Q is also true;
- When we know P Is false, then we know Q is also false; and finally
- When we know Q is false, then we know P is also false
- When we know Q is true, we don't actually know what P is (P is unknown)
Combined it gives us a proper cause and effect relationship.
Knowing P always gives us Q, but knowing what Q is don't always gives us the answer to P.
Knowing the "cause", we can always predict what the "effect" will be. The reverse is not always true - knowing the "effect" do not identify the "cause".
If knowing Q gives us the answer to P, then effectively P is the same as Q (a contradiction because P and Q are supposed to be different). Therefore, a claim will pass this logic test when"P always leads to Q", "if and only if" (this is the bounding predicate condition, ⇔) "not Q always means not P". You can refer to Wikipedia for a more in depth article on this, as well as the proof.
Now we look at the left hand side (LHS) of the equation (P → Q). If we let P be Audible and Q be Measurable), the left hand side of the equation now reads:
If something is audible, then it is measurable.
Exactly the same assertion claimed on the Internet. The LHS is quoted on a regular basis by the people in the second camp. The implication that there exists a very strong "one to one" relationship between measurable and audible.
However, for this statement to be true when applied under the transposition logic test, the right hand side (RHS) of the equation (¬Q → ¬P) must hold. In other words if we can show ¬Q don't always imply ¬P, then it means P don't always imply Q. To test this, with the same P and Q terms, the RHS now reads:
If something is not measurable, then it's not audible.
The RHS appears on surface to be a close resemblance to claim #2 from the previous page. That is not the case. The two claims in the previous page still follows the P → Q equation (just different P and Q terms). They are in fact not mathematically related, unlike the transposition logic equation shown here.
This RHS equation is hardly ever seen uttered on the Internet, and for good reason! Because there are several examples where something is not measurable but audible. By presenting only the LHS part of the equation, the second more militant camp is applying a passive aggressive form of dismissing a view point that do not agree with their world view - i.e. he is indirectly making his argument that anything you have claim cannot be real because measurements have showed no differences.
The RHS is often omitted because the latter is impossible to argue for because it can be shown to be false readily. And as far as transposition logic is concerned, both sides needs to be true for the claim to be true. If RHS is shown to be false, the LHS is too.
If we can prove that "if something is not measurable, then something is not audible" to be false, then the "If something is audible, then that something is measurable" is illogical.
Or as I prefer to call it - complete and utter bullshit.
Here is the first example of something that is not measurable, but audible. The following is an excerpt from the user manual of the Marantz SA11-S2 SACD player:
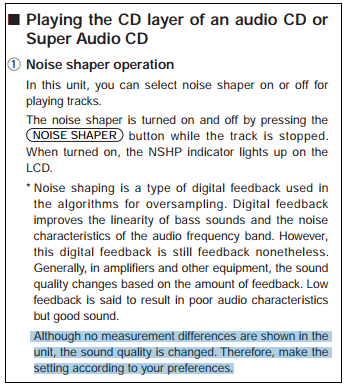
The text highlighted in blue demonstrates that something is audible but not measurable. In logic that is said to be Not Q implies P, and is written as such:
¬Q → P
When it cannot be shown that ¬Q → ¬P for all cases, then P → Q is not always true. Case closed and another audiophile myth busted!
We can pick the statement apart even further. What is the definition of audible and measurable anyway? There are no specifics, or context given. The two criteria are so open ended and poorly defined the statements are effectively meaningless.
A very common follow up retort is - "If something is audible and not measurable, then you are measuring the wrong thing". First of all, that is moving the goal post - they have re-defined what measurements are without actually knowing what it is.
Then it gets worse. Again if we apply the principle of transposition logic, we let:
P' be "If something is audible and not measurable"; and
Q' be "then you are measuring the wrong thing".
When we apply that to the RHS, ¬Q' → ¬P' in English becomes:
If "you are measuring the right thing" → "Something is not audible and measurable"
Honestly I cannot make this shit up no matter how hard I try. Personally I do not mind them moving the goal posts, but seriously? The retort to an illogical claim is to a more illogical claim? Are they trolling?
The above quote is actually important and is the key to how I listen, and how Snakeoil is developed. Stay tuned to the final chapter of this article!
There are actually a lot of audible effects that do not show up in measurements. To understand why we first have to briefly describe what measurements are. Unfortunately it is impossible to cover them all so we restrict to ourselves to the more common examples seen in Hifi literature.
Frequency responses charts is a form of measurements often used as "supporting evidence" when making these claims. To be pedantic, frequency responses are not strictly a measurement. They are a form of analysis derived from measurements. The distinction is important, as a frequency response chart can be derived from actual measurements, or simulated (i.e. calculated from a computer simulation). If you are comparing one chart from the other without knowing the origin then any conclusions drawn may be invalid.
The following is an example of a frequency response graph. The chart looks "Sciencesy", the red line looks pretty legit for some reason. The chart commands your attention, even more so when you have multiple charts on hand for comparison. They just do, this is a human reaction. People are naturally drawn to things of authority and charts have it all.
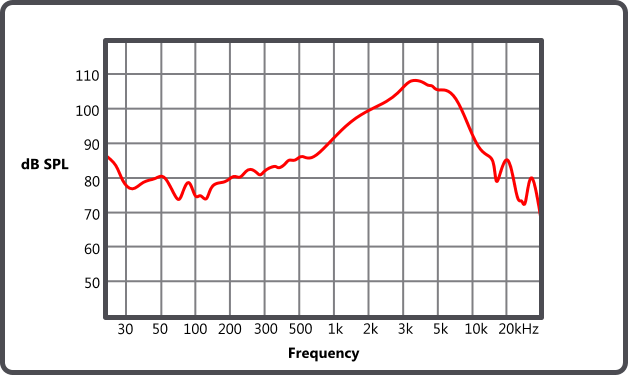
Few will realise:
- the X-Axis is not drawn to scale (logarithmic scale in this instance),
- the last X markers are also unlabelled (We assumed it to 40 kHz, but is it really?)
- Can we assume all the x labels before 1k are in Hz?
These issues showed how "the squiggly line" can be manipulated ever so subtly to have a misrepresentive visualisation.
What happens when we convert that authoritative chart into a table? Straight away the table has lost the superiority and legitimacy as we are far more accustomed to tables. It will also look like so (Note i'm only showing a partial table, and the Sound Pressure are rough visual estimations):
| Frequency (Hz) | Sound Pressure (db SPL) |
|---|---|
| 30 | 78 |
| 50 | 81 |
| 100 | 75 |
| ... | |
| 1000 | 91 |
| ... | |
Now we see this table for what they really are. The table effectively only tells you how loud each frequency is. We do not even know the source that generated these value pairs, are there really enough information for anybody to claim if it's audible then it's measurable? The reality is, nobody can do this reliability.
This blog post by JA from Stereophile is a good example of how something that effectively measures the same, can sound different : Link.
A comment by "cgh" in an online reprint of a Stereophile review caught my attention: "The [1990s] were probably the last real decade that we could reasonably bend the truth. Everything since is verifiable electronically."
Everything? After a quarter century of measuring the performance of audio components for this magazine, I'm not so sure that we have a firm handle on what makes audio products sound different from one another.
The above blog is a good read and I suggest everybody do so as JA can and has explain it a lot better than I have.
What other examples can a person hear but cannot measure? Here are some examples which hopefully you can recreate at home:
Image Height
This is the easiest to demonstrate.
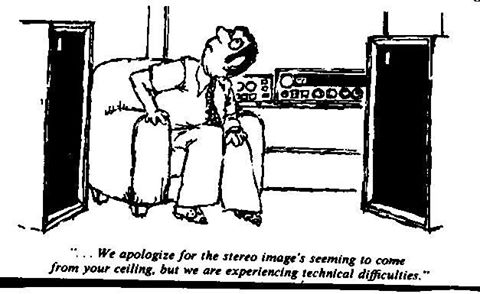
Have you ever played some music and notice some sounds are projected from very high up? Effectively fooling you into thinking the sound originated from somewhere in the ceilings. a location that appears to be far from the speaker source. An example is like hearing raindrops hitting a tin roof.
If you do not have a track that can demonstrate this effect, go out (or go to the Internet) and grab the album "Beyond Skin" by Nitin Sawhney. The sound track "The Pilgrim" is one of the best examples I'm aware of when demonstrating image height.
Image Clarity
Have you ever noticed sometimes when you swap out a power cable, or a interconnect, even a USB cable, and you suddenly realise the sound you hear seems to be a bit clearer than before? In a way this is is like putting on prescription glasses and suddenly you are getting clearer vision now - only this is like putting on something for the ear.
Clarity is something that is on my mind right now because of the addition of the Accuphase DC-37. After hearing mainly DSD and high reso (96 kHz or better) material, when I go back to redbook (44.1 kHz) the latter just seems to lack clarity now. In a way this is like looking at a 1080P picture for a while and then realise 576i video is very fuzzy now. The good thing is about a few short minutes of adjustment period that sensation is gone as I have re-tuned myself to what it is.
How do you measure image height and audio clarity? There are more metrics that are audible - sound stage width, image depth, timbre of various instruments, 3D sound localisation. How do you measure any of them?
Nobody can argue these are not audible effects, and yet none of these are measurable. There is a good reason for that.
All the commercial measuring gear available today are using the standard engineering units - e.g. Volts, Amps, Ohms, Watts. The relationship between some of these units are known, and we can easily convert them from one to another, and often infer other properties.
As an example, given we know the density of a object, when we measure and find out the volume of this object, it is possible to work out the mass without measuring it. Because density (ρ, kg/m3) is defined as mass (m, kg) divide by volume (V, m3), ergo to get mass (m) all we have to multiply ρ by V. Notice that when you multiply the units of density and volume together the unit m3 is cancelled out and you end up with the unit for mass (kg).
You cannot do the same with audio measurements, most typical audio measurements work in the sound pressure domain. There are no formulae available that can convert from a frequency response to any of the audible effects we can hear. When we are looking at a frequency response graph, all we can gleam is how loud it is, that on it's own means very little in the who general audio cognition sense.
As an example, if you measured two values of 0.999 and 1. What do these two measured numbers tell you? What does the difference of the value tell you? Do they really tell you if something is audible or not? Is the difference a measured difference, or measuring error? What do they mean in terms of image width, depth, and height?
To add another nail to this coffin - measurements today terms means electronic measurement. And that is another way of saying we are applying a Analog To Digital Conversion (ADC) process. ADC is the reverse of DAC (digital to analog conversion). Saying something is audible will be measurable is falling into the trap of thinking analog world and digital world is the same thing. They are not.
Measurements of audio gear begin as a QC/QA process. It is a quality control and assurance check to ensure the audio gear is performing as expected and to specifications. Sadly over the years this has morphed from the role of compliance to a role of performance. People are so focused on perceived performance they have lost touch what this hobby is all about.
There is no scientific basis to claim "If something is audible, then it is measurable".
Earlier on I have shown two Venn diagrams. This is the third version, and is my goal as the developer of Snakeoil, and as a audiophile.
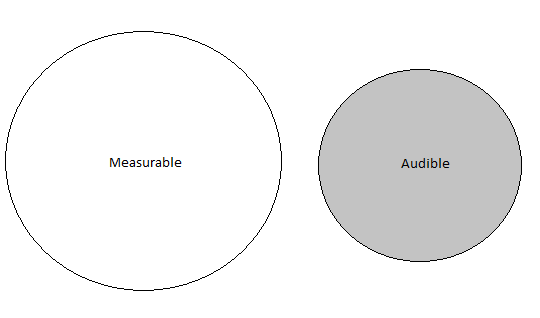
Contrary to what people expect, the two do not overlap at all. They only appear to be overlapping, but that is an illusion. Yes there is a correlation of measurements like bass/mid-range/treble that happens to coincides with the human hearing bands. That is a correlation and not an overlap.
Measurements is about capturing the physical characteristics of the world; audibility is the accumulated feedback you get from your sensory perceptions. Put it another way measurements can define and describe the physical properties of sound ways (and the generation of it). Audibility is about what you hear and those feelings that are induced when your body and ear drums are hit by these physical waves. Measurements is in the machine realm, it's about the gear. Audibility is in the human realm, it's about you.
Over the past five years or so I have stopped breaking down music into the bands of bass/mid-range/treble and just let myself go and give in to the music. Constantly aware of any physiological, physical and emotional changes. When listening to music, I'm looking for -
- the number of hairs that's raising on the back of your neck
- the cold shiver that runs up your spine
- triggering memories
- the suspension of disbelief as your mind is confused about what is real, and what is not
I call this active listening. It's a process that is very hard to explain - mainly because it's still a method I'm trying to figure out. But suffice to say this form of listening makes the gear totally disappear. It's no longer about the equipment now, or the sound quality of your equipment. Is is only music, and nothing else.
Before anyone jump up and down and accuse me of giving up measurements for good, or become a subjectivist instead of objectivist. Look at the Venn diagram again, the measurements are still there, and it is a bigger circle than the audibility one.
I am (re)defining a new ethos here. Do not have a name for it yet, but it is about going back to the roots of where we come from - our primal emotions. This is what I believe to be the bigger picture. Re-adjust oneself to stop thinking music in terms of bass/mid-range/bass/distortions/warm/bright/accurate/musical/<more audiophile terms> and think of music in terms of how it makes you feel.
If you succeed in doing this you are creating multiple portals of which you can enter, explore and experience the world from the perspective of the performers you are listening to. This is a surreal feeling and it can be a wild and crazy ride!
As an audiophile I have never felt happier, and enjoyed the hobby more using this method.
If you like alternate endings, insist on trying to identify and measure more things. Good on you! Just more action and less talk please!
This is a hard hill to climb. The more things you measure, the more complicated things becomes. You have to make sure all your measurements line up, establish whether there is a proper correlation, and work out the relationship between different measurements. The complexity scales up real quick real fast. In the commercial world, this means more expensive.
After all that, you may still end up with data that is useless. You will fail many times before you succeed. If that is your desire, go with it.
Make sure you are measuring the right things. If you want to measure what is audible, go straight to the source and measure yourself instead. And I do not mean blind testing either! Hopefully one day one of you can formalise a whole system for measuring these effects, creating a bridge between the physical to the emotional (the same way sampling theorem is a bridge between discrete and continuous). When you succeed you'd be collecting the equivalent of the Nobel Peace Prize in the Audiophile realm.


Add new comment